
Introduction
Need a report that finance can sign, auditors can follow, and site teams can act on? This guide focuses on the deliverable after the count—the physical verification report of fixed assets showing how to structure it so leadership gets the headline story, reviewers can trace the numbers, and action owners know exactly what to do next.
A physical asset verification report is the structured summary of what was checked, what was found, how discrepancies were classified, and what management will do next. For teams looking to understand how asset verification works in real scenarios, this report presents the outcomes in a clear and auditable format. It becomes audit-ready when it clearly states scope and exclusions, method and evidence, reconciliation to books, discrepancies by class and value, supporting schedules, and sign-offs.
In this guide, you’ll learn:
- What a physical asset verification report actually includes, and how sections like scope, findings, and reconciliation come together to tell a complete story.
- Why the report matters beyond documentation, since it helps finance, audit, and operations align on what was found and what needs action next.
- How to structure the report step by step, so numbers connect clearly to schedules, evidence, and final system updates without confusion.
- Finally, how to make the report audit-ready, as clear classifications, defined ownership, and a traceable audit trail turn a basic report into a reliable decision tool.
What should a physical asset verification report contain?
At a minimum, the report should tell a reviewer what was in scope, how the work was done, what was found, how big the issues were, and what happens next. Official guidance and procurement specifications strongly support that structure. CARO guidance expects management verification to show periodicity, reconciliation with book figures, discrepancy treatment, and supporting instructions, count sheets, tags, and formats. South African public-entity scopes typically require separate outputs for physical verification, location, damaged or missing assets, disposals, and reconciliation—making a single summary insufficient.
The minimum section set
Section |
What to include |
Why it matters |
|---|---|---|
| Executive summary | Objective, sites covered, completion dates, total assets reviewed, headline finding mix, actions requested from management | Gives leadership the decision-ready summary |
| Scope and exclusions | Entity, sites, asset classes, thresholds, excluded populations, cutoff date, and basis of exclusions | Prevents false assumptions about coverage |
| Methodology and evidence | File-to-floor, floor-to-book, hybrid, field dates, evidence captured, count rules, alternative controls | Lets finance and audit judge reliability |
| Findings summary | Matched assets, not found, unrecorded additions, wrong location/custodian, damaged/idle/obsolete, duplicates, exceptions | Quantifies the outcome clearly |
| Discrepancy analysis | Count and value by class, site, business unit, or cost center | Converts raw issues into materiality and control insight |
| Recommended actions | Write-off, capitalization, location update, retagging, disposal, impairment review, policy remediation | Turns findings into decisions |
| Supporting schedules/annexures | Asset-level logs, location variance list, exception log, condition report, matched schedule, evidence references | Gives auditors and controllers the details behind the summary |
| Sign-off and closeout | Owner, reviewer, approver, date, unresolved items, and next review date | Closes the loop and preserves accountability |
One rule many teams miss
If no discrepancies were found, say so clearly. CARO guidance specifically notes that if no discrepancies were noticed during physical verification, that should be clearly mentioned. That sounds small, but it prevents reviewers from wondering whether the report forgot to state the result.
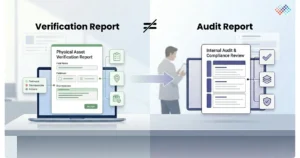
A verification report is not the same as an audit report
Document |
Main purpose |
Primary audience |
What it should not try to do |
|---|---|---|---|
| Physical asset verification report | Summarize verification fieldwork, discrepancies, and actions | Finance, asset team, site owners, management | Replace the auditor’s working papers |
| Internal audit note/report | Assess whether controls were designed and operated effectively | Internal audit, audit committee, management | Replace the asset-level schedules |
| Statutory audit working paper | Support the auditor’s conclusion and testing trail | External audit team | Serve as management’s operating report |
| Reconciliation memo | Explain how field differences were resolved in the records | Finance/controllership | Replace the full verification summary |
A good verification report can feed the audit note and the auditor’s workpapers, but it is not identical to either one.
Original contribution: the 3-layer report pack
Most ranking pages mention report components in passing. This article should own the more useful idea: a single “report” is usually not one file. The cleanest approach is a 3-layer report pack.
Layer 1 – Management summary
This is the 2–4 page version for finance leadership, plant heads, asset owners, and business reviewers.
It should include:
-
- Objective and date of completion.
- Sites and asset classes covered.
- Headline findings by count and value.
- Material control or reporting issues.
- Decisions are required from management.
- Action owners and deadlines.
Layer 2 – Working schedules
This is the structured detail pack, usually in spreadsheet form.
It should include:
-
- Matched-assets schedule.
- Not-found schedule.
- Unrecorded-additions schedule.
- Location/custodian variance schedule.
- Damaged/idle/obsolete schedule.
- Exclusion / alternative-control schedule.
- Summary by site, class, and value.
Layer 3 – Evidence trail
This is the traceability layer behind the numbers.
It should include:
-
- Source population used for the cycle.
- Field logs or mobile exports.
- Photo/geo / serial evidence references where required.
- Discrepancy approvals.
- System update log.
- Sign-offs and closeout notes.
This 3-layer structure is where AssetCues can differentiate. Competitor pages usually tell readers what a report includes. They rarely show how to package the report so management gets clarity and auditors get traceability. TagMyAssets and MAS both mention report content and reconciliation outputs, but neither really formalizes the separation between summary, schedules, and evidence.
Sample report format
Management-friendly version
Section |
What it should say |
|---|---|
| Title and period | “Physical Asset Verification Report – FY 2025–26” |
| Executive summary | Short narrative of coverage, result, and decisions required |
| Scope | Sites, asset classes, thresholds, and exclusions |
| Headline metrics | Total assets checked, matched %, not found %, unrecorded additions %, condition exceptions |
| Top risks | The 3–5 most important reporting or control issues |
| Action summary | Who must do what, by when |
| Sign-off | Finance lead + business/site owner |
Audit-support version
Annexure |
What it should contain |
|---|---|
| A. Population and scope file | Register version, site list, cutoff date, exclusions |
| B. Method and evidence note | Method used, dates, verifier teams, evidence rules |
| C. Summary by class/site | Counts and values by asset class, site, department |
| D. Discrepancy log | Asset-level exceptions with codes, owner, and status |
| E. Condition report | Damaged, idle, obsolete, and under-repair assets |
| F. Movement and location schedule | Wrong location and wrong-custodian items |
| G. Book-update tracker | Changes posted to FAR/ERP/CMMS and approval references |
| H. Sign-off and unresolved items | Remaining open items, due dates, and approvals |
Sample executive summary snapshot
Below is a realistic example you can adapt:
Metric |
Example result |
|---|---|
| Sites covered | 22 manufacturing and warehouse locations |
| Assets reviewed | 48,260 |
| Matched | 92.4% |
| Wrong location/custodian | 3.1% |
| Not found | 1.7% |
| Unrecorded additions | 2.8% |
| Damaged / idle/obsolete | 116 assets flagged for review |
| Highest-risk populations | Portable tooling, calibration devices, shared IT endpoints |
| Immediate management actions | Update transfer records, investigate not-found items, validate off-book additions, review damaged assets for repair/disposal |
That kind of summary is more useful than a generic “verification completed successfully” sentence because it gives leadership scale, risk, and action in one view.
How should findings be classified?
A strong report does not bury issues in narrative paragraphs. It uses controlled categories so counts, values, ownership, and actions can be summarized consistently. CARO guidance reinforces the need to note discrepancies by asset class and value and state how they were dealt with. Recent South African specifications also expect separate reports for location, damaged/redundant/missing assets, and reconciliation outputs, which works best when finding categories are standardized up front.
Discrepancy classification dictionary
Category |
What it means |
How to show it in the report |
Primary owner |
Typical next action |
|---|---|---|---|---|
| Matched | Asset record aligns with physical result | Count/value summary by site and class | Asset team | No action beyond confirmation |
| Not found | In register but not traced physically after recheck | Separate schedule with ID, description, last known location, value, and investigation status | Site owner + finance | Re-verify, investigate, and approve write-off if unresolved |
| Unrecorded addition | Found in the field but not in the register | Separate schedule with estimated value/source docs status | Finance + procurement/operations | Validate ownership and capitalization |
| Wrong location/custodian | Asset exists, but not where or with whom the record says | Location variance schedule by site or cost center | Operations/facilities / ITAM | Update master data and review movement discipline |
| Damaged / idle/obsolete | Asset exists, but the condition/status needs action | Condition exception schedule with severity and business impact | Maintenance/business owner + finance | Repair, redeploy, impair, or dispose |
| Duplicate/stale record | One asset appears twice or remains on the books after retirement | Duplicate / stale-record schedule with value impact | Fixed asset accounting | Merge, retire, or correct history |
| Exception-controlled asset | Standard verification is not practical | Exclusion / alternative-control schedule | Engineering/contract owner | Attach approved alternative evidence |
Always show count and value where you can. Counts show operational scale, while value shows materiality and reporting impact. That is especially important for India-facing readers because CARO-style reporting turns on whether discrepancies were material and how they were dealt with in the books.
How do you build the audit trail behind the report?
A report is only as defensible as the trail behind it. AssetCues’ software page is useful here because it explicitly highlights tamper-proof audit logs that capture time, user, and location details. Its services page also emphasizes audit-ready documentation and structured data handoff. Those capabilities map directly to what a good report pack needs.
6 steps to make the report traceable
- Freeze the source population.
Record the asset-register version, site list, and cutoff date used for the cycle. - Link every headline number to a schedule.
Each summary count or value should tie to an annexure reference. - Preserve raw field outputs.
Keep the mobile export, count sheets, serial logs, or evidence references in a read-only location. - Track approvals and book updates.
Show which discrepancies triggered write-off, capitalization, transfer, repair, disposal, or policy actions. - Retain timestamps and user history.
>If software was used, keep the audit log that shows who captured or changed what and when. - Close with sign-off and unresolved items.
Do not issue the report as “final” without naming any open exceptions and due dates.
The simplest audit-trail test
If a reviewer selects any number from the executive summary, can they trace it all the way through to:
- Supporting schedule
- Asset-level entries
- Evidence source
- Approval decision
- Posted system change
If the answer is no, the report is not fully audit-ready.
What makes a report audit-ready?

An audit-ready report is usually not the longest report. It is the report that removes ambiguity. CARO guidance is useful because it effectively describes the minimum audit-support logic: was verification done, was periodicity reasonable, were book figures agreed or reconciled, what discrepancies existed by class and value, how were they dealt with, and what formats or count sheets supported the exercise. South African public-entity specs add a second lesson: reviewers often need separate outputs for location, damaged/missing assets, reconciliation, and proposed accounting adjustments.
Audit-ready checklist
- Define the scope and exclusions clearly, so reviewers understand what you covered.
- Specify cycle dates and locations, ensuring full visibility of where and when you performed the audit.
- Describe the method and evidence standards used, so the process stays transparent.
- Present asset counts and values by class or site, making the data easy to review.
- Classify discrepancies with clear definitions, so you avoid confusion in interpretation.
- Assign action owners and set target dates, ensuring accountability for resolution.
- Show reconciliation and system update status, so records align with reported figures.
- Attach annexures and evidence references, allowing reviewers to trace supporting details.
- Include final sign-off and disclose unresolved items, so the report remains complete and credible.
One high-value clause to add
If some sites, classes, or secure zones were excluded, say so explicitly. Reviewers should never have to guess whether a missing asset population was excluded or simply forgotten.
Common reporting mistakes
- Writing a narrative summary with no annexures
Management may understand it, but audit and finance cannot test it. - Showing counts without values
That hides materiality. - Failing to state exclusions
Readers assume full coverage when coverage was partial. - Combining condition findings with existence findings in one vague bucket
Damaged or obsolete assets often need a different follow-up from missing assets. - Listing findings without owners or due dates
That turns a report into a backlog. - Calling it “final” before system updates are approved and posted
The register remains wrong, so the cycle is not truly closed. - Treating the verification report as the same thing as the audit report
It is a key input, not the same document.
Country-specific report modules
→ USA: Make the report usable in control review and follow-up
US readers expect the report to enable clear, structured management follow-up with defined ownership and next actions. SEC rules require management’s annual ICFR report to include management responsibility, the framework used, and management’s assessment of effectiveness. A fixed-asset verification report does not replace that annual report, but it should support management’s control story by showing scope, exceptions, remediation, and evidence retention clearly.
What to include for US readers
- Control the owner and reviewer.
- Material exception flag.
- Remediation status.
- Evidence-retention note.
- Linkage to year-end control review.
→ India: Include a CARO-ready annexure checklist
India-focused teams should produce reports that directly support CARO-style audit questions. CARO guidance explicitly asks whether PPE was physically verified, whether the periodicity was reasonable, whether PPE agreed or reconciled with book figures, and if discrepancies existed by class/value, how they were dealt with. It also points to instructions, count sheets, tags, formats, and management representation.
What to include for Indian readers
- Cycle periodicity note.
- Class-wise discrepancy summary by value.
- Statement on how discrepancies were dealt with in the books.
- Count-sheet / tag/format reference.
- An explicit statement that no discrepancies were observed.
→ United Kingdom: Write the summary for material-controls review
For UK readers, the report should help management or the board understand whether fixed-asset controls remain effective where they are material. The FRC’s 2024 Code says Provision 29 asks boards to make a declaration about the effectiveness of their material internal controls. That makes unresolved high-risk exceptions, weak site coverage, and poor remediation especially important to summarize clearly.
What to include for UK readers
- Unresolved high-risk exceptions.
- Coverage gaps across sites or estates.
- Remediation completed before year-end.
- Management conclusion on control effectiveness support.
→ South Africa: Mirror public-entity style outputs
South African public-sector and public-entity materials are especially concrete about report outputs. Recent RFQs call for asset verification reports, asset location reports per office, damaged/redundant/missing schedules, asset master listings, reconciliation outputs, and proposed journal entries; they also expect room/inventory lists signed by custodians in some cases. This makes South Africa the clearest market for a report-heavy, annexure-led content angle.
What to include for South Africa readers
- Asset location report per office.
- Damaged / redundant/missing schedule.
- Asset master listing or reconciliation annexure.
- Proposed journal-entry schedule where applicable.
- Custodian-signed room or inventory lists where relevant.
Key Takeaways
- Physical asset verification report works best when it clearly connects what was checked, what was found, and what needs action, so every reader knows the outcome and next steps.
- Instead of a single document, an effective report is usually structured in layers—a summary for decision-makers, detailed schedules for review, and an evidence trail for traceability.
- Clarity improves usability, so findings should be properly classified, supported with both count and value, and linked to responsible owners for follow-up.
- At the same time, transparency matters—scope, exclusions, and even “no discrepancies” must be stated explicitly to avoid confusion.
- Ultimately, a report becomes truly useful when every number can be traced back to source data, evidence, and approved actions, ensuring it stands up to both management review and audit scrutiny.
Conclusion
A physical asset verification report should do more than prove that a count happened. It should show what was covered, how reliable the result is, what went wrong, who owns the next action, and how the books and systems will be updated. When teams structure the report that way, it becomes useful to controllers, auditors, plant heads, facilities teams, and asset managers at the same time.
That also becomes the natural next step for AssetCues—once you know what a strong report should look like, the focus shifts to how you deliver it consistently. The fixed asset verification software supports mobile verification, audit logs, and fully traceable actions, while the services side ensures audit-ready documentation, structured data handover, and dependable annual verification support, which together cover exactly what’s needed to move from understanding to execution.

FAQs
Q1: Should the report include values as well as counts?
Ans. Yes, where possible. Counts show operational scale, while values help finance teams assess materiality and book impact. CARO guidance specifically refers to discrepancies by class and value.
Q2: How should missing assets be reported?
Ans. Missing assets should be listed clearly by identifier, description, last known location, value, and investigation status. Do not bury them in narrative text.
Q3: Should the report include exclusions?
Ans. Yes. If some assets or locations were out of scope, say so clearly. Otherwise, reviewers may wrongly assume the report covered the full population.
Q4: Who should sign the report?
Ans. At a minimum, the project owner in finance and the relevant business or site owner should review and sign it. Internal audit may also review, depending on governance expectations.
Q5: Can one report serve management and audit?
Ans. Sometimes, but the strongest approach is usually a management summary plus detailed annexures. Different audiences need different levels of detail, even when they rely on the same facts.
Q6: What supporting schedules are most useful?
An. A matched-assets schedule, exception log, location variance list, damaged/idle asset list, and action tracker are usually the most useful. South African public-entity scopes often also expect location, damaged/missing, and reconciliation outputs as separate reports.
Q7: Can software generate the report automatically?
Ans. Software can generate much of the raw output, especially discrepancy logs and audit trails, but the final management narrative and action framing still need human review. AssetCues’ software page explicitly highlights audit logs, and its services page highlights audit-ready documentation.


")
")


